Donald Trump's Tax Plan in Two Charts
A few days ago, Donald Trump released his new tax plan. This morning, the Tax Foundation released its analysis, which found that (with a dynamic model) the plan would lead to a 11 percent higher long-term GDP, but also significantly increase the deficit.
The Tax Foundation’s analysis is all well and good, but it doesn’t pay enough attention to some of the more interesting aspects of Trump’s plan. So I figured, hey, macroeconomic modeling is basically lame data science, right? And I did my own.
First, one distinctive feature of the tax plan is that low-earners
would pay no taxes. Instead of filing a return, they would send in a
piece of paper that says I Win.
I modeled the number of Americans
who would be winning before and after Trump’s tax plan: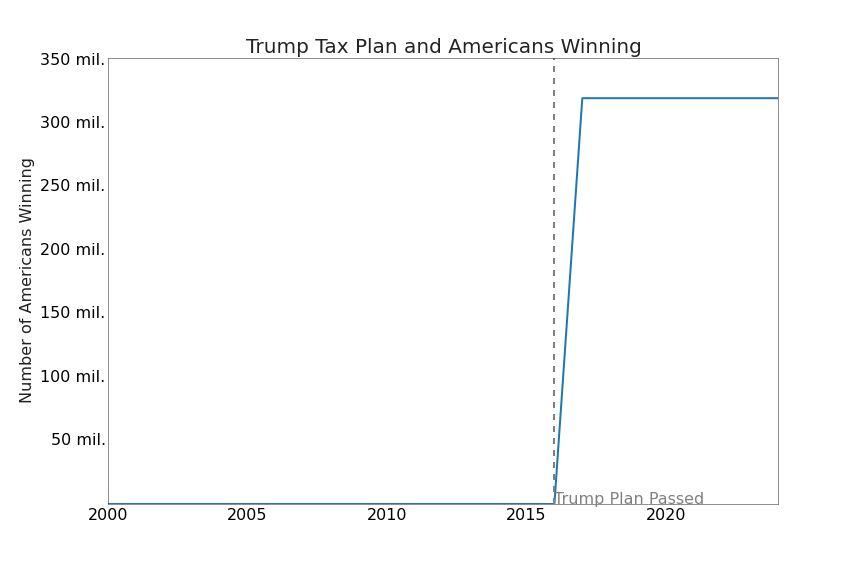
I find that the number of winning Americans goes up about 300 million fold after the implementation of Trump’s tax plan. Note that, before implementation, the number of winning Americans is not quite zero; that’s because Donald Trump is, and has historically been, winning. He is a winner and he wins.
Second, Trump’s plan is focused on making America great again. I
modeled Gross National Greatness, with these results: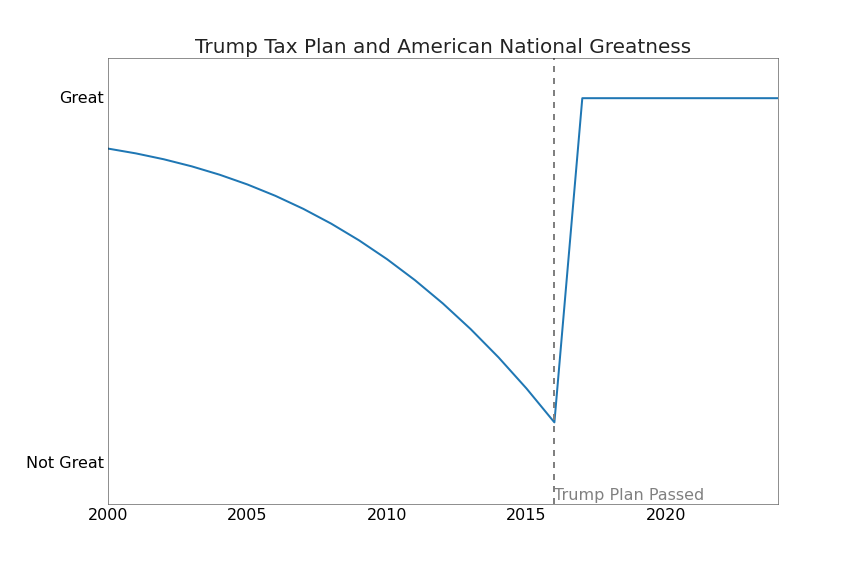
Note that the sharp decline in greatness seen since 2000 is completely reversed after implementation of Trump’s plan. In fact, the level of greatness achieved is higher than that seen since 2000. However, I should caution that these results should not be over-interpreted; some portion of the expected increase in greatness is likely due to other greatness-reviving policies of the Trump administration.