You Asked For It: 430 Model Projections for Iowa
Just before the Iowa Caucuses, I showed how you can make a 80-percent-of-the-way there poll-based election forecasting system with surprisingly little work. I called it the 430 Model, because 430 is about 80 percent of 538, and I was ripping off Nate Silver. My model did OK on the Democratic side, though (like the polls) it was off on the Republican side; Trump’s support was overstated, or rather the opposition to Trump was understated.
But, since people have been interested, I’ve updated the model a bit and made forecasts for New Hampshire! I’ve simplified the weighting decay function to halve the weighted sample size for a poll each day1. I’ve also added limited my results to polls with likely voter screens, and set the window of polls included in the super-poll by number instead of by date. You can download and play around with the new model as a Jupyter notebook here.
So, let’s get to the fun!
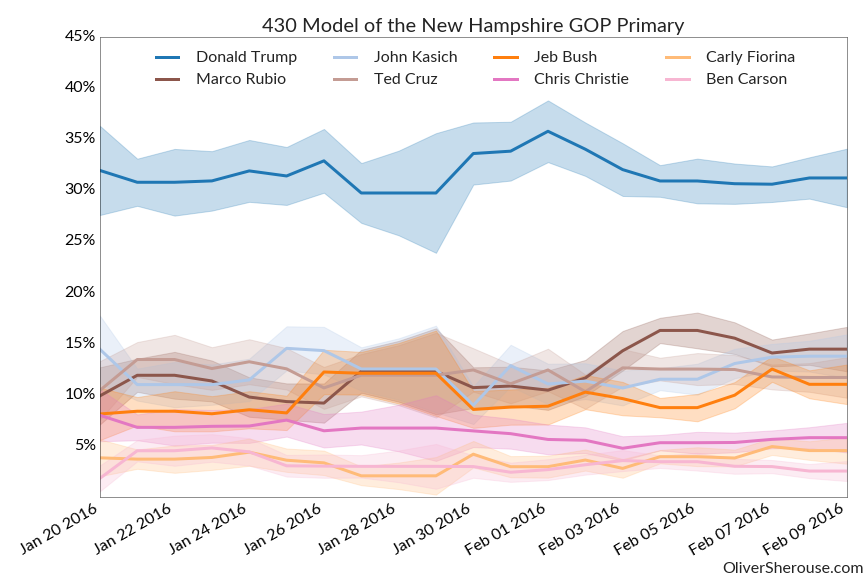
This is what the New Hampshire race has looked like over the last
three weeks on the GOP side, when polling has happened pretty
steadily:
The picture’s been pretty stable the whole time. There’s three tiers: the down-and-outs (Christie, Fiorina, Carson), the hope-for-seconds (Rubio, Kasich, Cruz, Bush), and Trump. The superpoll results bear that out:
| Candidate | Estimate | Standard Error |
|---|---|---|
| Donald Trump | 31.2% | 1.7% |
| Marco Rubio | 14.5% | 1.3% |
| John Kasich | 13.8% | 1.2% |
| Ted Cruz | 11.7% | 1.2% |
| Jeb Bush | 11.0% | 1.1% |
| Chris Christie | 5.8% | 0.8% |
| Carly Fiorina | 4.6% | 0.7% |
| Ben Carson | 2.6% | 0.6% |
Rubio’s bump has gotten him to the top of the second tier, but realistically those guys are all tied, and each of them (except Cruz) really, really wants a second place finish. First place seems utterly out of reach for all of them; in my 10,000-trial simulation, Trump won every single time.
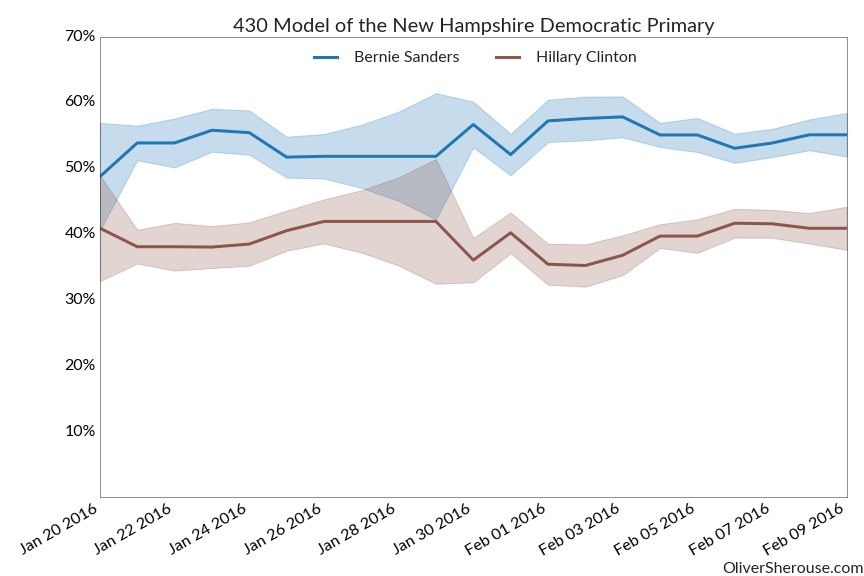
On the Democratic side, things seem equally fatalistic:
Not even a story there. Bernie Sanders is winning. So also says the superpoll:
| Candidate | Estimate | Standard Error |
|---|---|---|
| Bernie Sanders | 55.1% | 1.9% |
| Hillary Clinton | 40.9% | 1.9% |
As Trump did on the GOP side, Sanders wins every time in a 10,000-trial simulation.
But.
Polls have historically been bad in New Hampshire. These projections are a great summary of what the polls are telling us, but if the polls are consistently off by a significant amount, we could still get some real surprises. If I were Sanders or (especially) Trump, I would actually wish my numbers were a little worse; in both cases, not dominating is going to look like a loss. It’s entirely possible that one of those second-tier GOP candidates is really going to break out, though I have no idea who it would be or why.
Or maybe they’ve finally learned how to poll New Hampshire and this
is all effectively a done deal. We’ll find out tonight! This sounds more extreme than it is. A poll with 300
respondents has a margin of error of about 2.9 percent, one with 150
respondents about 4.1 percent, and one with 75 respondents about 5.8
percent. When you think about how many people can change their minds
every day during an election, that looks reasonable to me.↩︎