Back in January, I introduced the 430
Model for using polls to forecast elections. The name comes from the
idea that you get 20 percent of your results from 80 percent of your
work, and I only wanted to do about 20 percent of what Nate Silver does
with FiveThirtyEight.
Since then I’ve wanted to do a bigger and better version for the
general election. But since I’m the kind of guy who only wants to do 20
percent of the work, most of that didn’t happen. But I do have a
slightly bigger and better version! So that’s something.
As before, I’m using the poll data from the Pollster
API, combining the results and weighting by age to create a
super-poll. Then I’m running 10,000 simulations using the results of the
super-poll to figure out how likely each candidate is to win.
The code for this version is in a Jupyter
notebook on GitHub, so you can play with it if you want to pretend
Jill Stein matters or something.
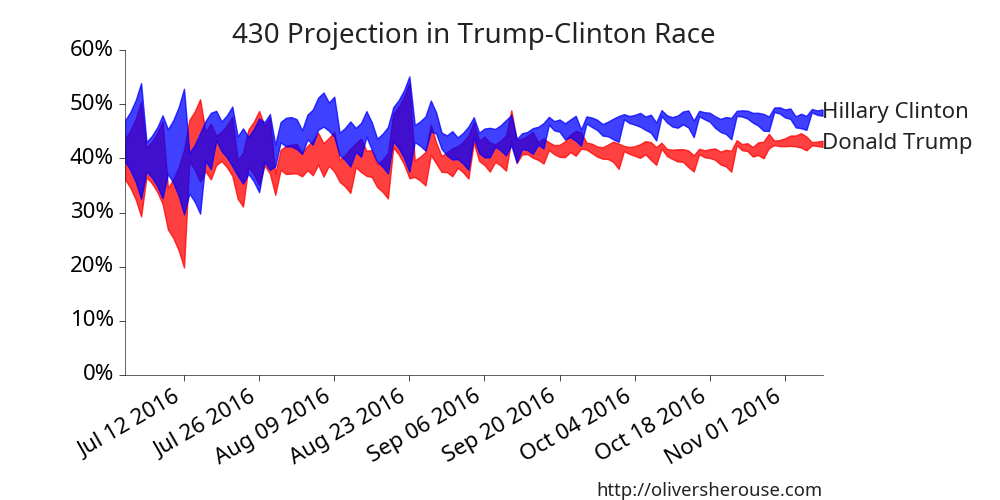
Now to the results! Using the super-poll results since July, the race
has looked like this:Clinton is winning by a lot in the
super-poll
Those lines are the 95% confidence bands. The story here is that,
while things were pretty uncertain early in the race, Clinton began to
separate after the first debate in September, and Trump has never been
able to catch up. The recent revelations about the emails, for all the
sturm und drang they caused, don’t really show up here. She’s just
ahead. How ahead? This ahead:
Candidate
Mean
Standard Deviation
Hillary Clinton
48.4%
(0.2)
Donald Trump
42.7%
(0.2)
Other
8.9%
(0.1)
Well, she’s not over fifty. But five and a half points is a pretty
solid lead with as many polls as we’ve had. In 10,000 trial simulations,
she won every single one. That’s as comfortable as you get.
So, any caution? If, as many suspect, there’s a weird Trumpian
version of the Bradley Effect,
then he has a better chance than the model projects, which is none. But
with 0.2 percentage points standard error, he needs to get to swing
better than two and a half points if he’s drawing them all from Clinton,
and More if he’s getting them from the Other category. In the
best case, that’s one secret supporter to every public one. That’s a
tough road to hoe.
Still, this is a strictly poll-based model. If the polls are
systematically wrong, then so is the model. We didn’t really
see systematically wrong polling in the primaries, though we have seen
it in votes abroad, such as Brexit. But that has to be the hope, if
you’re a Trump supporter: that the polls are almost all wrong and in the
same way.
Data work can take a long, long time. Once you’ve moved beyond small
scale projects, you just have to get used to doing something else while
your machine chugs away at cleaning, preparing, or analyzing your data.
And since most of the time you have to try a few things to see what
comes out, you’ll have to do sit and wait through multiple rounds of
each step.
But a lot of people make it worse by doing one of two things: either
they have one big script which they re-run from start to finish every
time they make a change, or they run each step on-demand (say, in an
Jupyter notebook), and mentally keep track of what they need to do in
what order.
The first is bad because every single run will take the whole run
time, and your life will be swallowed up in waiting. The second is bad
because you have to depend on yourself to keep what can be a pretty
intricate map of your analysis flow in your head.
The Unix utility Make
provides a better solution. Make is the old standard build system,
designed to help with the compilation of large programs. Just like with
data projects, compiling large programs takes forever, has a variety of
smaller steps where you might need to go back and edit something, and
has a web of dependent steps you might need to re-run depending on what
you’ve changed. In other words: it’s a perfect fit.
What’s more, Make helps you keep your steps separate computationally,
which helps you keep them clear conceptually. You don’t even
have to use the same language with each step: I’ve had occasion to mix
Python, Scala, and Stata in the same project,1 and
make made that much less painful.
And here’s the good news: if you’re on a Mac or Linux, it’s probably
already installed. On windows, just install Gow.
So how does it work? The basic idea is, you write a makefile
filled with recipes that tell you how to make a
target. Each target can have dependencies, and if a
dependency has been modified more recently than the target, the recipe
for the target gets re-run.
So let’s say I want to classify some text in a folder, using some
trainers in another folder. Both have to be prepped for analysis, using
a script in my scripts subdirectory. I might put the following recipe in
my makefile:
What’s going on here? The file before the colon is the target, the
thing we’re trying to make. The files after are dependencies, things
that need to be made before the target. The line beneath, which is
indented by a tab—yes, a tab—is the command that makes
the file. Now, if we were to run make data/clean/trainers,
make would check to see if either the clean_text.py script or the
trainers directory2 had been modified more recently than
the output file, and if so, it would run the script to create the
file.
In a makefile, $@ stands for the target, and
$^ stands for the list of dependencies in order. This means
if our dependencies are a script and a list of arguments to that script,
we can use them as a stand-in for the recipe.
Now let’s say we use the same script to clean the unlabeled input. We
just need to add it as a new target:
Easy! Now if we update clean_text.py, Make knows we need to remake
both those targets. But I hate repeating myself. Luckily, Make gives us
canned recipes:
So that’s five scripts total: each reasonably separated and able to
be dropped into other projects with minimal modification. If we change
any of them, either because of a bug, or because we wanted to try
something different, we can use make to update only those parts that are
dependent on the chain. And if we just type the command
make, it automatically makes the first recipe, so we can be
sure that our output.csv is using all the latest and greatest work we’ve
put in.
There’s a lot more to Make, and I’ll focus in on a few features,
tips, and tricks in an occasional series here. It’s been a big help to
me, and if you find it helpful too, I’d love to hear from you!
Just before the Iowa Caucuses, I showed how you can make a
80-percent-of-the-way there poll-based election forecasting system with
surprisingly little work. I called it the 430 Model, because 430 is about 80
percent of 538, and I was ripping off Nate Silver. My model did OK on the Democratic
side, though (like the polls) it was off on the Republican side; Trump’s
support was overstated, or rather the opposition to Trump was
understated.
But, since people have been interested, I’ve updated the model a bit
and made forecasts for New Hampshire! I’ve simplified the weighting
decay function to halve the weighted sample size for a poll each day1. I’ve also added limited my results
to polls with likely voter screens, and set the window of polls included
in the super-poll by number instead of by date. You can download and
play around with the new model as a Jupyter notebook here.
So, let’s get to the fun!
This is what the New Hampshire race has looked like over the last
three weeks on the GOP side, when polling has happened pretty
steadily:New Hampshire GOP Chart
The picture’s been pretty stable the whole time. There’s three tiers:
the down-and-outs (Christie, Fiorina, Carson), the hope-for-seconds
(Rubio, Kasich, Cruz, Bush), and Trump. The superpoll results bear that
out:
Candidate
Estimate
Standard Error
Donald Trump
31.2%
1.7%
Marco Rubio
14.5%
1.3%
John Kasich
13.8%
1.2%
Ted Cruz
11.7%
1.2%
Jeb Bush
11.0%
1.1%
Chris Christie
5.8%
0.8%
Carly Fiorina
4.6%
0.7%
Ben Carson
2.6%
0.6%
Rubio’s bump has gotten him to the top of the second tier, but
realistically those guys are all tied, and each of them (except Cruz)
really, really wants a second place finish. First place seems utterly
out of reach for all of them; in my 10,000-trial simulation, Trump won
every single time.
On the Democratic side, things seem equally fatalistic:New Hampshire Dem Chart
Not even a story there. Bernie Sanders is winning. So also says the
superpoll:
Candidate
Estimate
Standard Error
Bernie Sanders
55.1%
1.9%
Hillary Clinton
40.9%
1.9%
As Trump did on the GOP side, Sanders wins every time in a
10,000-trial simulation.
But.
Polls have historically
been bad in New Hampshire. These projections are a great summary of
what the polls are telling us, but if the polls are consistently off by
a significant amount, we could still get some real surprises. If I were
Sanders or (especially) Trump, I would actually wish my numbers were a
little worse; in both cases, not dominating is going to look like a
loss. It’s entirely possible that one of those second-tier GOP
candidates is really going to break out, though I have no idea who it
would be or why.
Or maybe they’ve finally learned how to poll New Hampshire and this
is all effectively a done deal. We’ll find out tonight!
This sounds more extreme than it is. A poll with 300
respondents has a margin of error of about 2.9 percent, one with 150
respondents about 4.1 percent, and one with 75 respondents about 5.8
percent. When you think about how many people can change their minds
every day during an election, that looks reasonable to me.↩︎